WorkWell — Discover What Matters Most to Your People and Where to Improve First
Most employee surveys tell you how people feel about their workplace. WorkWell goes a step further. It helps you understand what matters most to your employees, how they experience their workplace today, and where improvements would make the biggest difference.
Employees participate in two short rounds of pairwise comparisons. You receive clear priorities to help you decide where to focus first.
Understand what matters most, and how things are today
Instead of rating statements on a 1–5 scale where everything looks equally important, participants compare carefully calibrated workplace statements in pairs across two rounds:
What matters most to your employees?
Employees compare carefully selected statements to show what they value most in a good workplace.
How well are these things working today?
Employees compare the same statements based on their experience of the workplace today.
Five key areas of workplace wellbeing and productivity
WorkWell covers 30 carefully selected statements across five areas that influence how people feel and perform at work. Here are examples of what we ask.
Meaningfulness of daily tasks, ability to use personal strengths, achievement, and autonomy in everyday work.
Clarity of goals and priorities, reasonable time pressure, recovery, and having the right tools and information to succeed.
Mutual trust, open communication, psychological safety, fairness, and everyday support from colleagues.
Supervisory support, constructive feedback, transparent decision-making, and clear responsibilities across teams.
Confidence in the continuity of work, occupational safety, learning opportunities, and ability to improve ways of working.
Why we use 30 carefully selected statements
The statements are based on established research and years of practical experience. Together, they give a balanced view of workplace wellbeing and productivity. You can also add questions specific to your organisation.
See what your WorkWell results reveal
Every WorkWell delivery provides a clear visual report showing your organisation’s core strengths, urgent priority gaps, and how perspectives differ across teams.
Significant Priority Gaps
High importance in the Ideal State, but low realisation in the Current State. These are your primary focus areas for improvement.
Core Organisational Strengths
High importance in the Ideal State and strong performance today. Protect and build on these capabilities.
Dynamic Gap Map, Illustrative Example
Current State vs. Ideal State
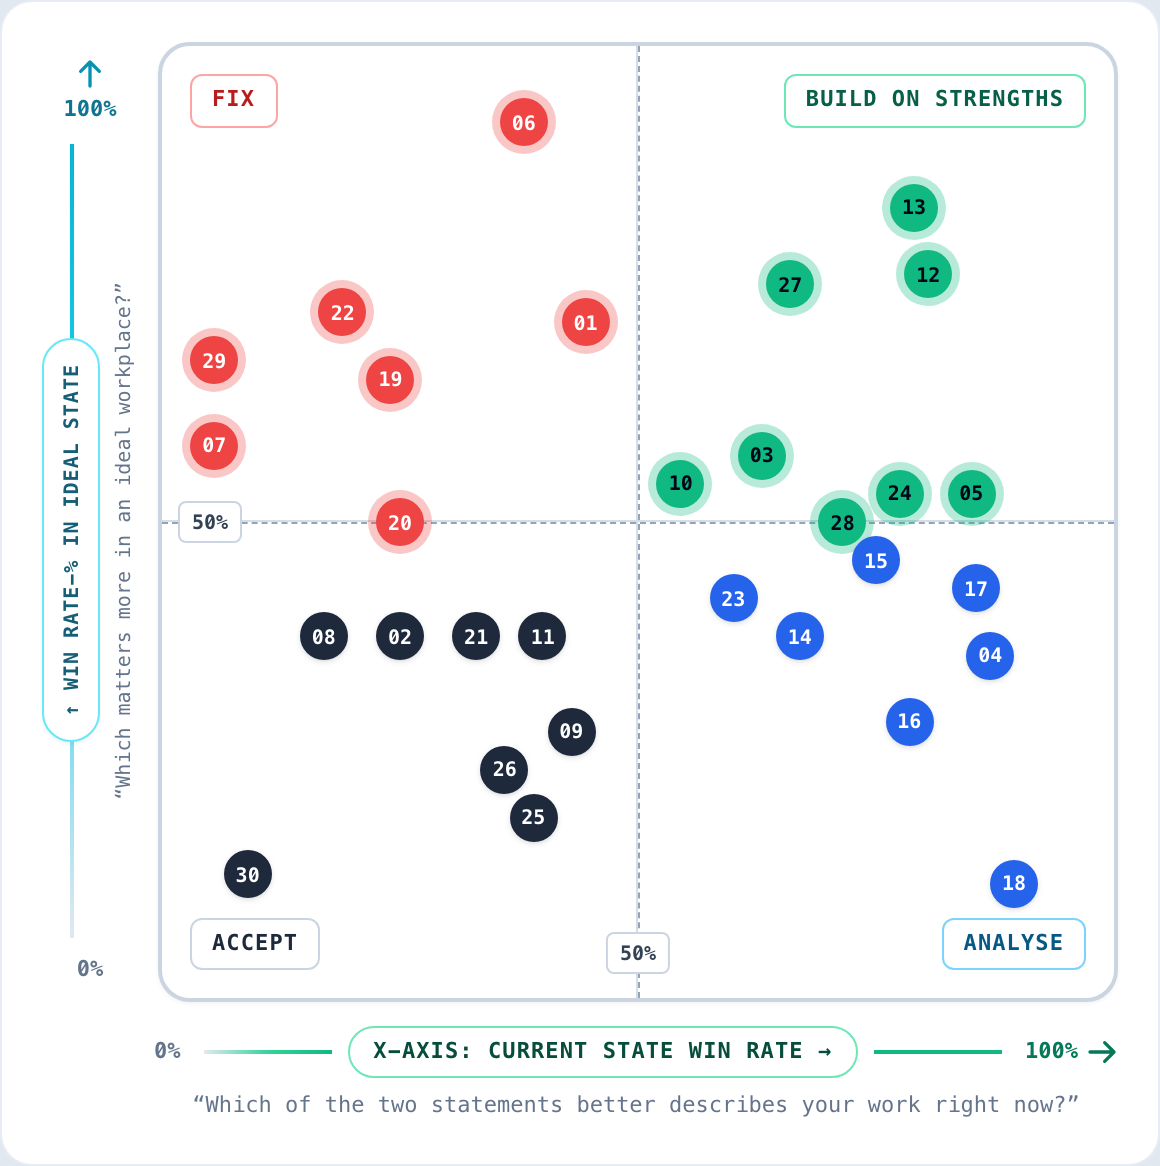
How to interpret the four quadrants
The map compares the Current and Ideal State, helping you identify strengths, gaps and areas that need attention.
Critical organizational gaps. These items represent what people value most but feel is least realized today.
High importance in ideal state and strong in current state. Protect or strengthen these capabilities.
Strong in current state but low in ideal state. Potential misallocated effort, as participants consider them relatively less essential for success.
Low in ideal state and current state. No need to act.
Ranked Priority Gaps, Illustrative example
Statements sorted by Priority Gap (Ideal State win rate − Current State win rate)
| Statement | Ideal State | Current State | Priority Gap |
|---|---|---|---|
| I feel secure about the continuity of my work. | 71% | 0% | +71 pp |
| I achieve important things in my work. | 100% | 38% | +62 pp |
| I can use my strengths in my work. | 93% | 34% | +59 pp |
| Information flows openly and on time in our workplace. | 83% | 28% | +55 pp |
| My supervisor supports me when needed. | 79% | 28% | +51 pp |
| Goals and priorities are clear in my daily work. | 86% | 38% | +48 pp |
We handle the process. You focus on the decisions.
We handle the setup, participation and analysis, so you can focus on discussing the results and deciding what to do next.
Define respondent groups and communication
We configure your teams, roles, or locations (e.g., Management, Supervisors, Operations) and provide ready-to-send invitation templates.
3–10 minute anonymous pairwise survey
Employees participate easily on mobile or desktop. Real-time response tracking helps ensure high participation across all groups.
Gap mapping and group perspective comparison
We compile the Dynamic Gap Map, priority rankings, and group comparisons into an executive-ready report.
Review the results and agree on your next steps
We walk through the findings with your management team to identify where to focus.
Standard WorkWell Delivery from
Excludes VAT. Includes setup, stakeholder engagement, dynamic reports, and management review session.
Request a WorkWell proposal →Want to understand what matters most to your employees?
Let's discuss how WorkWell could help your organisation, or arrange a short walkthrough of an example report.